Introduction
In this lab ground control points are utilized to help make our final outputs more accurate, and reduce some of the distortions that can exist without GCPs. GCPs are specific locations in the surveyed area that have a known coordinate allowing for more accurate location calibration within the software. The fact that the GCPs have known coordinates will increase the quality of our output tremendously by being able to more accurately organize the surrounding images based on their proximity to the ground control point. Checkpoints can also be used to help increase the quality of a product. While ground control points are used as a georeference for the product, checkpoints simply check accuracy of the model by showing the percent error of the images.
Methods
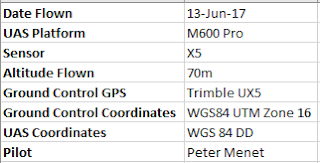
The metadata for this specific flight is shown in figure 1 below.
 |
| Figure 1: Flight metadata |
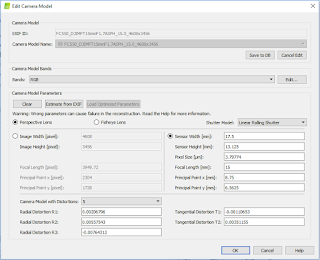
As with some of the previous labs, based on the specific sensor used for the flight, the shutter type must be changed from global to linear rolling in the camera model portion of the setup. This change can be seen in figure 2.
 |
| Figure 2: Changing shutter type to linear |
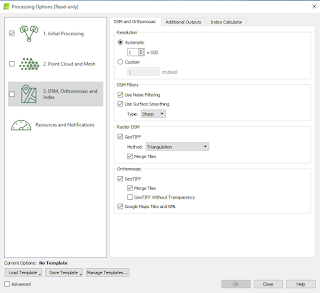
Additional changes to be made prior to initial processing are changing Raster DSM's GeoTIFF method to Triangulation, and enabling Google Maps Tiles under orthomosaic as shown in figure 3. We also tried to have a 3D PDF made, but that step failed during the processing.
 |
| Figure 3: Google Maps Tiles and Triangulation changes |
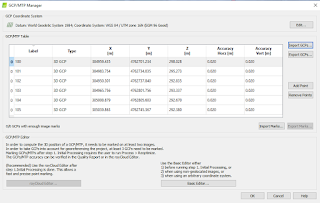
After these changes were made, we added our ground control points. Adding GCPs is very simple, and is done through the GCP/MTP Manager. Figure 4 and 5 below show the addition of our ground control points. These points, as discussed earlier, should help to make the model more accurate through geolocation referencing.
 |
| Figure 4: Importing GCPs |
 |
| Figure 5: GCP/MTP Manager |
Our GCPs have now been added and it is time to begin the initial processing to ensure the quality of the processing. Some of the things checked for are the percent of images used, the overlap of the images, and the image calibration matching. These statistics, and much more, are included in the Quality Report that is created after initial processing has finished.
lab_6_wolf_gcp_report. After the initial processing had finished and was assessed to ensure accuracy of our data, the rest of the processing for our DSM and meshes began.
After our processing had completed, the ground control points must be calibrated. Figure 6 shows the ground control point locations on the model prior to calibration. Pix4D has misplaced the ground control points. They are both sitting well above the actual height of our model, in addition to some discrepancies in the horizontal location as well. Calibrating these is as easy as clicking on the ground control point and actually lining it up with the image of the ground control point ourselves. Figure 7 and 8 show the ground control points after calibration.
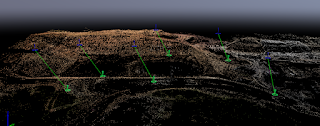 |
| Figure 6: Calibrating GCPs |
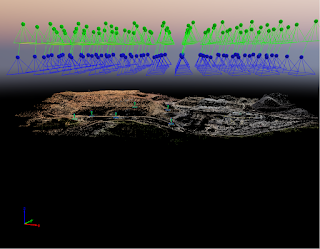 |
| Figure 7: GCPs Calibrated |
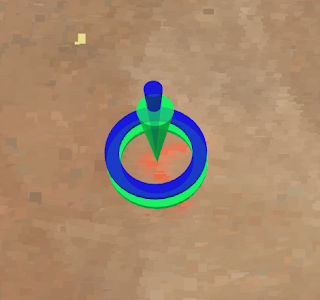 |
| Figure 8: GCP Calibrated (up close) |
After the calibration of the ground control points, we had Pix4D reoptimize our data to better align and stitch our images together for our model. The GCPs ended up making a pretty big difference in a lot of tougher areas. There are still some issues with over blending of certain areas, but the overall product is much better than without GCPs. Figure 9, 10, and 11, and 12 below highlight some of the high and low quality areas of the model.
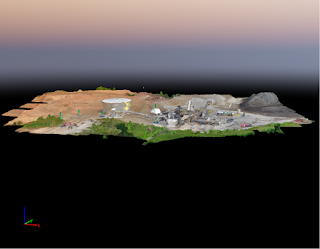 |
| Figure 9: Mesh and point cloud enabled |
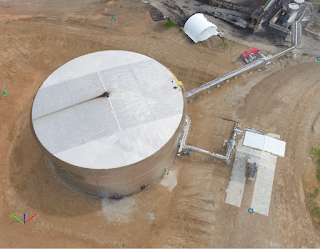 |
| Figure 10: High quality stitching |
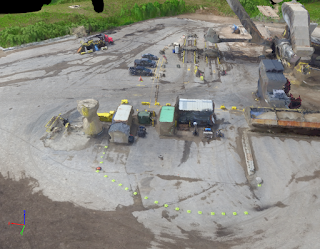 |
| Figure 11: High quality stitching |
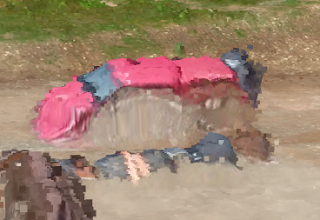 |
| Figure 12: Poor blending of the ground with a vehicle |
After analyzing the model and checking for areas of high and low quality, the data was exported to ArcMap to create maps of both the orthomosaic and digital surface model.
Discussion
Figure 13 below shows the orthomosaic map created using the wolfpaving data set. The image is very clear and the quality is quite high. The ground control points are overlaid on the map, and after our manual recalibration of the GCPs, they are actually almost perfectly aligned as was shown in Figure 8. Our quality report tells us that the project error on each ground control point is very minimal, with some of them having as little as 8cm of error. Pix4D was able to align our data much better than without them causing our model to be of a higher quality than before. Figure 14 shows the same map but using the digital surface model instead of the orthomosaic.
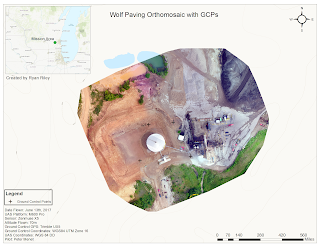 |
| Figure 13: Wolf Paving Orthomosaic with GCPs |
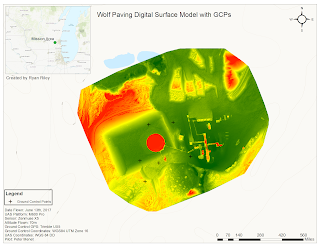 |
| Figure 14: Wolf Paving DSM with GCPs |
Conclusion
The utilization of ground control points was key in helping create a more accurate representation of our survey. Based on figure 6 where we see how inaccurate the ground control points were picked up as by Pix4D, our data is considerably more accurate than before. It is likely that some of the issues with our data being offset from the imagery basemap in the previous lab would have been corrected had ground control points been used. In future use, it will be good to make sure ground control points are used in order to create the most accurate product.


Comments
Post a Comment