Processing Data in Pix4D Without Ground Control Points
Introduction
What is Pix4D?
Pix4D is a photogrammetry software often used with UAS data for 3D mapping purposes.
What products does it generate?
Pix4D can be used to create orthomosaic images, terrain and surface models, animated flight paths, and more. These generations require imagery to have at least a 75% frontal overlap, and a 60% side overlap (in more uniform fields these percentages jump up to 85% and 70% respectively). Both nadir and oblique images can be used. However, with oblique images, the sensor angle must be between 0 and 45 degrees and pointing in both track to the center of the corridor. Additionally, multiple flights can be processed together as long as the images have the proper amount of overlap, and meteorological conditions are fairly similar. Ground control points can be used, but are not required, in Pix4D. They can be used as a georeference for the images which will help reduce some of the noise and distortion that can occur in data processing.
At the end of the initial processing Pix4D gives the user a quality report. This report gives information about the image/data processing showing a wide array of information ranging from how many images were calibrated, the percent overlap of the images, previews of the outputs, and more.
Why is Pix4D so integral to UAS data processing?
Pix4D is so integral to UAS data processing due to its ability to process nearly any set of data thrown at it. The results may not always be pretty, but Pix4D will give results. There are also ways that the software can be used to process data quickly which is useful in the field to check on the data briefly to ensure flight paths are correct, the overlap is adequate, and that the data is correct. This process is called Rapid Check, and is essentially the initial processing step that has been conducted in lab. Rapid Check sacrifices accuracy from the full processing features to give very speedy results.
Many different sensors can be used on UAVs to collect data. Pix4D defaults these sensors to a global shutter, though in this lab we edited this feature to linear rolling shutter. The difference between the two is that global shutter captures and entire image simultaneously, while rolling shutter captures the image line by line from top to bottom.
Methods
The first steps of the process is getting all of your data added, and ensuring all of the settings are set correctly. First we add the images to Pix4D. This can be done either by adding specific images, or choosing the directory the images are in and all of them will be added. Then we make sure the automatically selected coordinate system is accurate, and if it isn't we change it. The camera model and shutter type should be examined. In this case the shutter type needed to be changed from global to linear rolling.
The next step is selecting what the output should be. We selected 3D maps. After adding Google Maps tiles and a few other miscellaneous settings, we ran the Initial Processing by itself. A quality report was printed, as was discussed earlier, and a summary was included. Figure 1 below shows the summary of the quality report.
As seen in Figure 2, one image was rejected as can be noticed in the 66/67 images were used. The rejection was likely due to poor overlap. Nearly the full orthomosaic has 5 or more overlapping images. Figure 3 shows the amount of overlap. The southeast corner of the map has a few spots with only 1 or 2 overlapping images. This is likely due to the images that were removed from the dataset because they were outside the survey area. Figure 4 shows the flight path data that was actually used for this project, but the actual images taken that were removed from the data set extend further east.
 |
| Figure 1: Quality Report summary |
| Figure 2: Quality report data set |
 |
| Figure 3: Image Overlap |
 |
| Figure 4: Flight path |
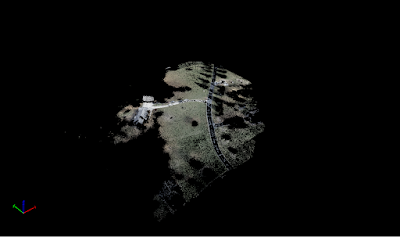
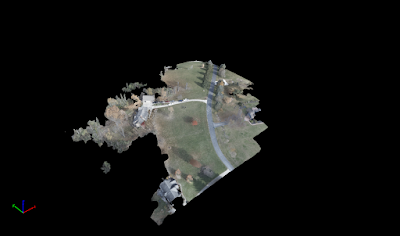
After the initial processing of the data was complete, and the quality report was analyzed to make sure everything was going smoothly, the more intense processing steps could begin. Step 2 is to produce a Point cloud and mesh, while step 3 produces the DSM, orthomosaic and index. Figure 7 below shows the orthomosaic without the point cloud and triangle meshes enabled, while Figure 8 below that enables them. The difference in quality between the enabling and disabling of those two features is astounding. The individual pixels are very noticeable without them enabled, whereas the landscape blends together much more naturally with them enabled. In the next lab we will be utilizing ground control points on a different data set that should make the project look even smoother. Processing times for each of these steps is shown in Figures 5 and 6 below.
 |
| Figure 5: DSM & Orthomosaic processing times |
| Figure 6: Point cloud and 3D mesh processing times |
 |
| Figure 7: Orthomosaic without point cloud and mesh |
 |
| Figure 8: Orthomosaic with point cloud and mesh |
One very interesting feature of Pix4D is the ability to create animations utilizing the work that has been created. Below is the video I created of the fly-through over our 3D orthomosaic.
Figure 9 below shows the flight path that Pix4D uses to create the video.
 |
| Figure 9: Video flight path |
As always, we turn our data into maps, I chose to use ArcMap to create them. We used Pix4D to create both a digital surface model, and an orthomosaic, so maps of both will be displayed. Figure 10 shows the orthomosaic map overlaid on the Imagery basemap, while Figure 11 shows the DSM map overlaid on the Imagery basemap once again.
 |
| Figure 10: Orthomosaic map |
 |
| Figure 11: DSM map |
As for the DSM map, the DSM itself shows that the center of the map is a high point. I don't believe this is actually the case, but Pix4D recognized the data and processed it to reflect as such. This is one of the many issues with the data that ground control points could help resolve. Other than that, the DSM shows the trees fairly accurately as having higher elevation, but there do exist some issues with the trees north Dr. Hupy's house. The elevations just seem a bit off there which could be due to some of the distortions happening there. Overall, the data turned out quite well though.
Conclusion
Pix4D is incredibly important for processing UAS data because of the incredibly job it is able to do in stitching images together. Without the point cloud and 3D mesh the output is rather empty. However, with their inclusion, the project comes to life and paints a fairly accurate representation of the landscape. The data that initially gets used is very important. Flight paths must include a large amount of overlap if a good output is expected. Processing times can be quite heavy as well. Even with a small data set like this one, only 67 images of which 66 were used, the orthomosaic took almost 20 minutes to create while the point cloud took nearly 30. With larger data sets this processing time will increase dramatically. The addition of ground control points would help with the processing times a bit by giving better georeferences for the images. On the lab computers, processing the data was about all that we could do while the data was actually processing. In addition to the time they take, the creation of these projects requires a lot of computing power, so the computer is essentially useless for any other tasks while the processing is taking place unless it is a very high end system. Pix4D does a good job at what it is trying to do. There are likely better programs for specific situations, but Pix4D does a good job all around.

Comments
Post a Comment